← All work

Case study

NGEN EQ

Institutional-grade equity research and portfolio analytics for every NSE- and BSE-listed stock — designed, built, and operated end to end by ARK Angel Labs.

Fintech B2B SaaS India Equities
Visit ngeneq.in ↗

Overview

Terminal-depth research, packaged for an individual practice

NGEN EQ covers every company listed on India's two stock exchanges with the depth an institutional analyst expects — full financial statements, 57 ratios, peer benchmarking, quantitative price and risk analytics, Monte Carlo forecasting — alongside tools advisers rarely get in one place: a portfolio backtester with benchmark-relative attribution, live watchlists with analytics, a whole-universe screener, and AI commentary refreshed through the trading day. One click produces a client-ready research report or a multi-sheet Excel workbook.

It is the equities counterpart to NGEN Markets — the same analytical depth, applied stock by stock. ARK Angel Labs delivers the platform end to end: nightly data pipelines, the in-browser analytics engine, the web application, and the self-serve commerce stack behind it.

7,000+NSE & BSE listed securities covered
10+ yearsof daily price history behind the analytics
115screener statistics per stock
57 ratiosper company, across 10 groups

Capabilities

What the platform does

Stock workspace

Seven tabs per stock: price and risk analytics, 57 key ratios, full financial statements, peers, forecasts, company profile, and corporate activity.

Probabilistic forecasting

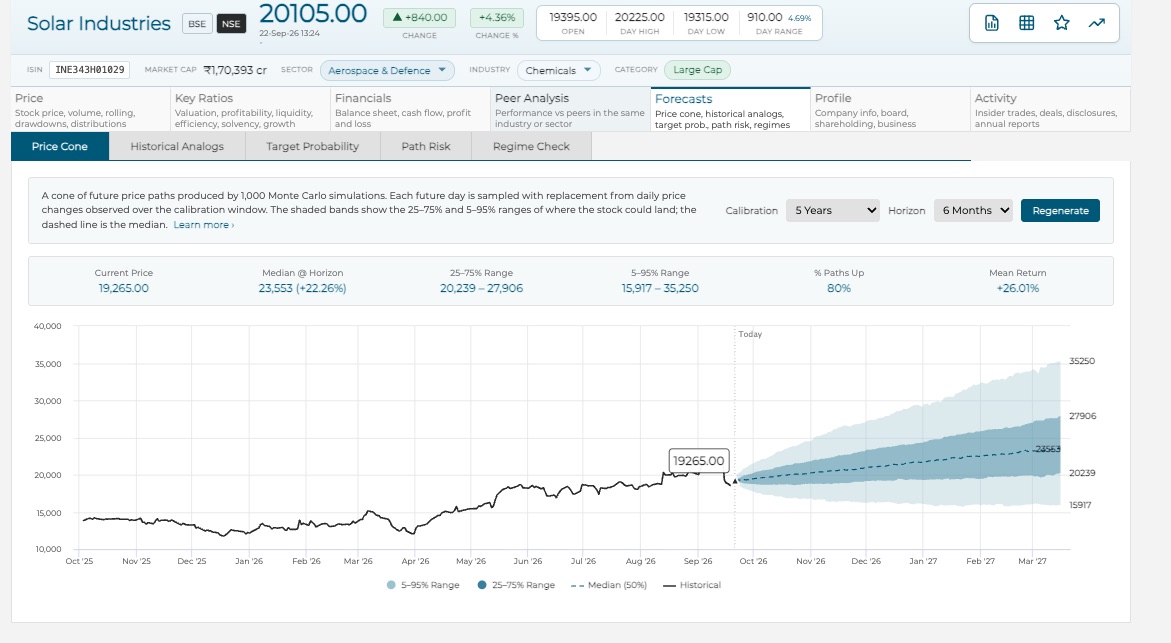
A 1,000-path Monte Carlo price cone, target probability, path risk, historical analogs, and a regime check — each with plain-English explainers.

Peer benchmarking

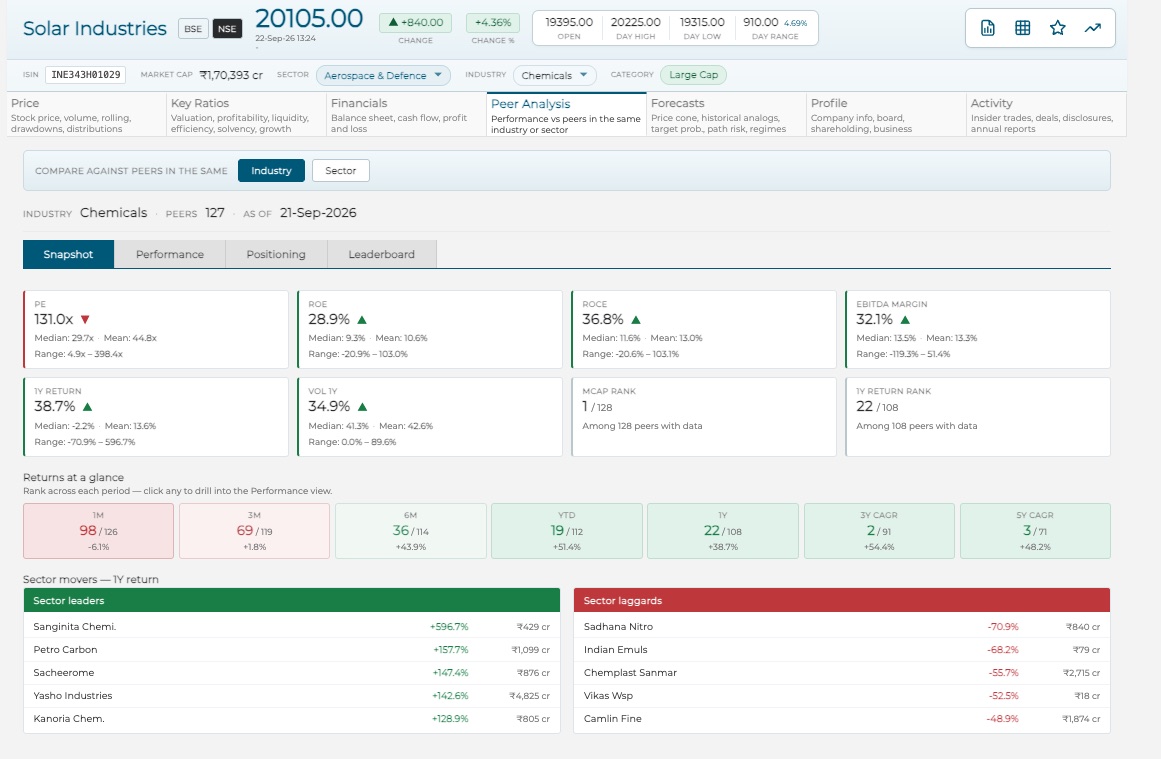
Snapshot tiles against the peer median, seven-period performance ranks, positioning maps, and sector leaders and laggards.

Portfolio backtesting

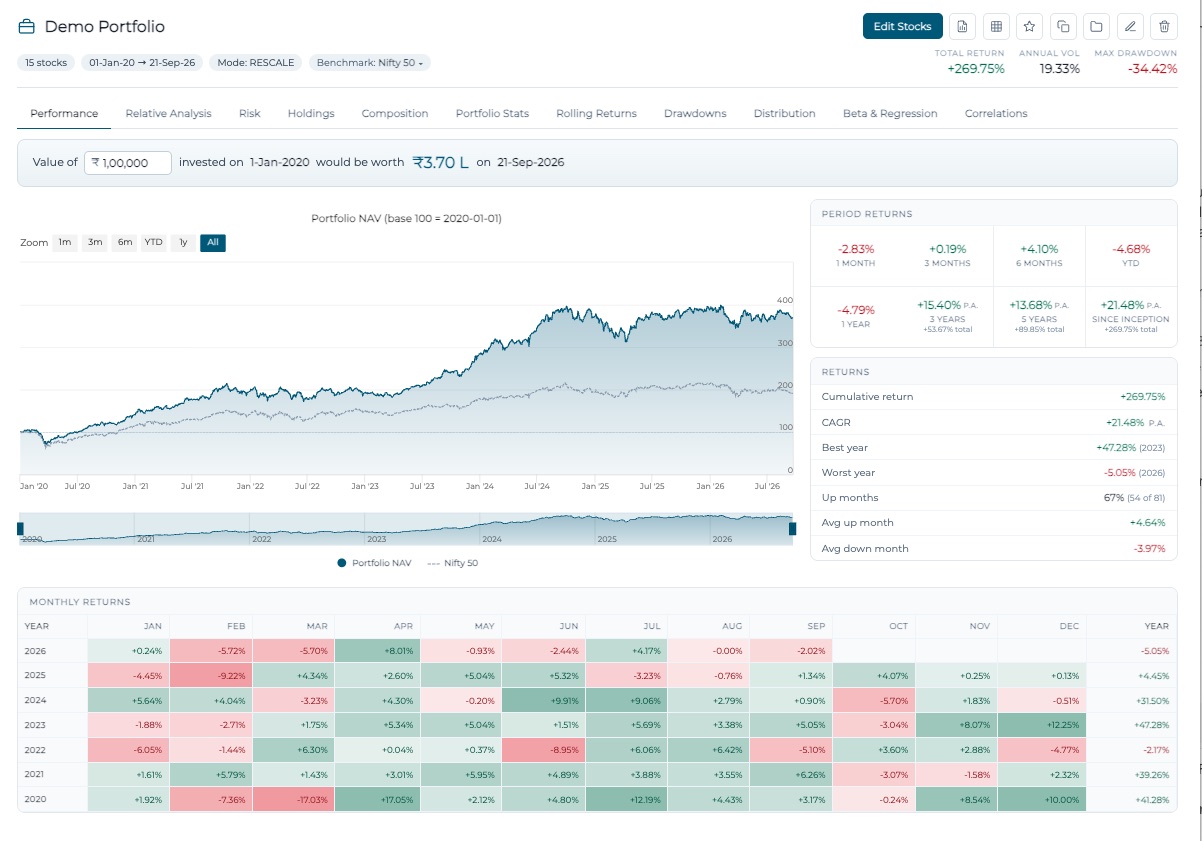
Fixed-weight portfolios over a decade of daily data, with benchmark-relative alpha, tracking error, capture ratios, and eleven analytics tabs.

Depository import

Client holdings land straight from NSDL and CDSL statement PDFs or an Excel template — so analysis starts from the client's actual book.

Screener & watchlists

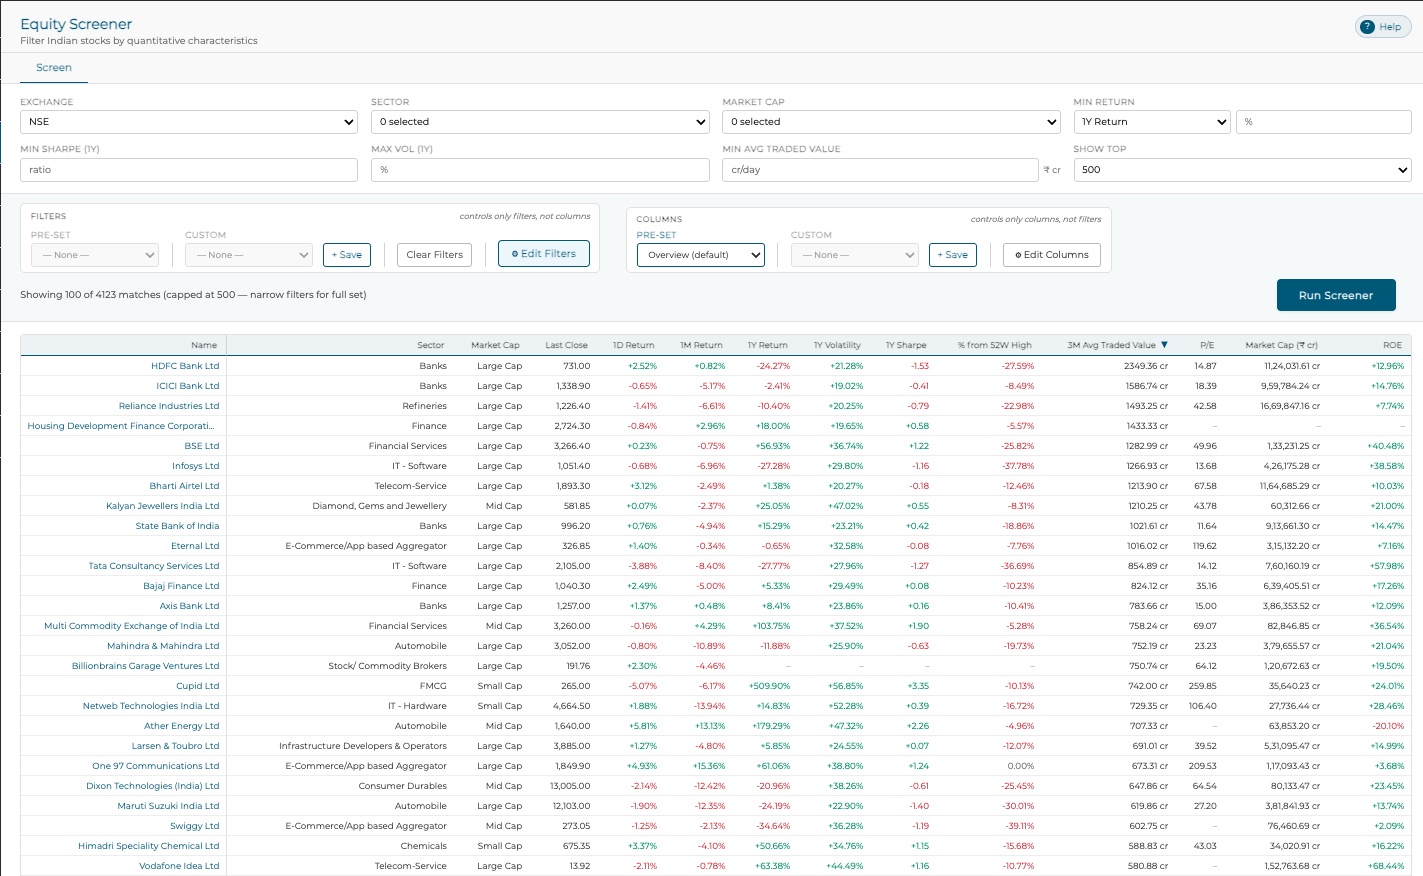
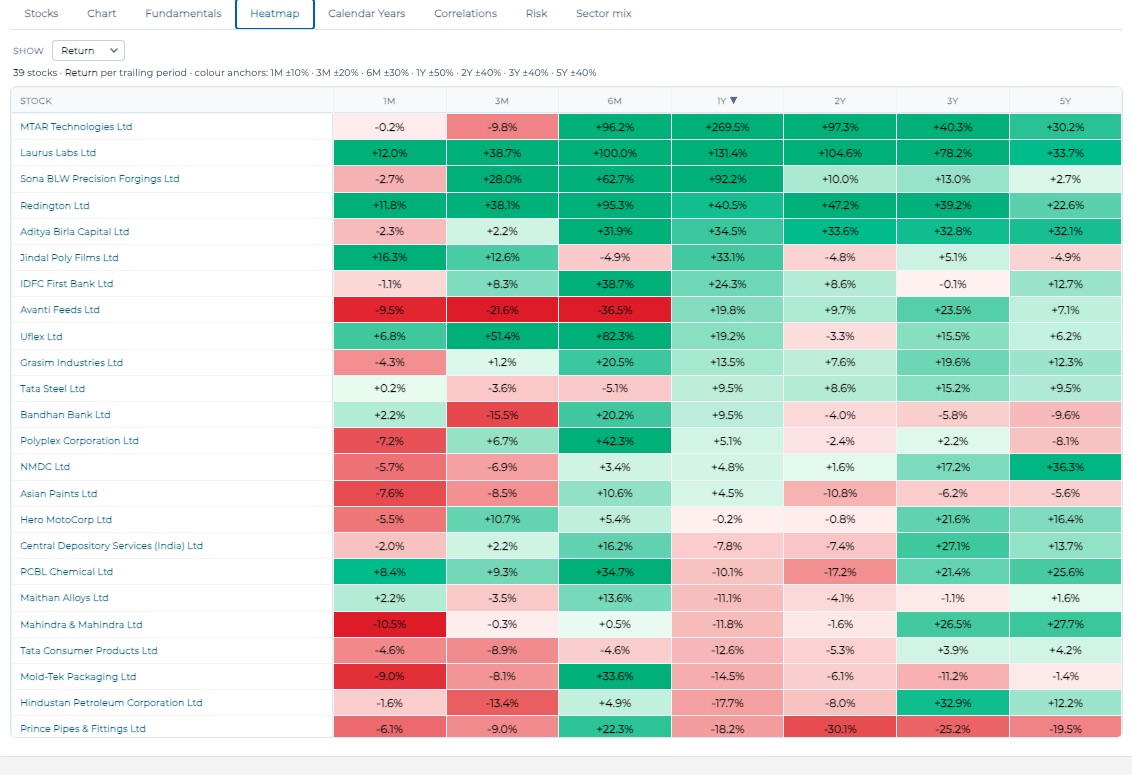
The full NSE/BSE universe filtered across 115 statistics, plus live watchlists with heatmaps, correlations, calendar returns, and risk views.

Client-ready outputs

A one-click research report of up to eight pages with white-label branding, and an Excel workbook of up to fourteen sheets per stock.

AI market intelligence

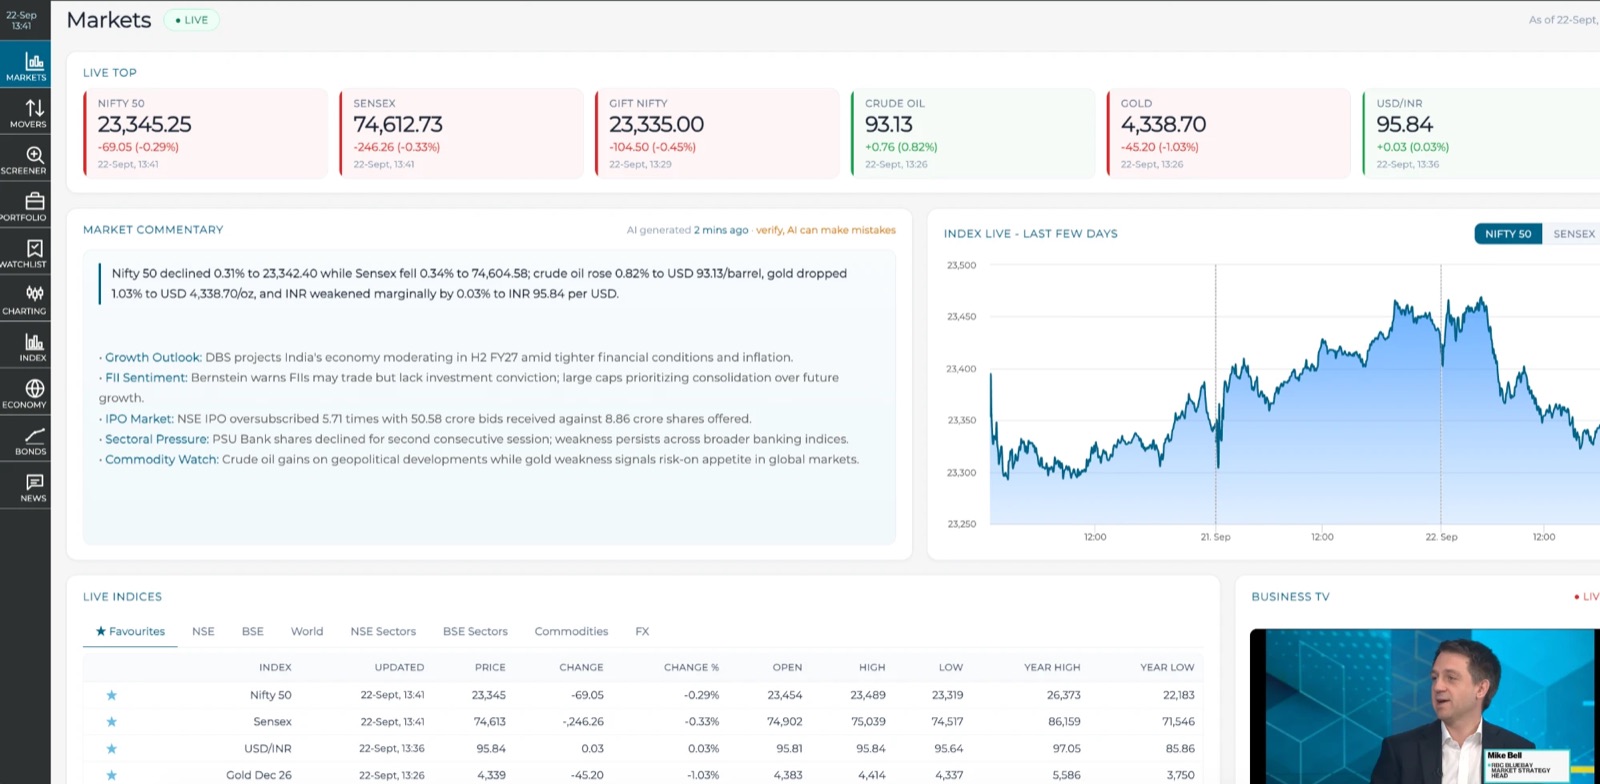
Live commentary, mover summaries, and news digests regenerated through market hours — time-stamped and labelled as AI-generated.

In the product
A closer look

NGEN EQ markets dashboard with live index cards, AI market commentary, and an intraday index chart
The markets dashboard: live indices, AI commentary regenerated through the trading day, and an embedded business-TV feed.
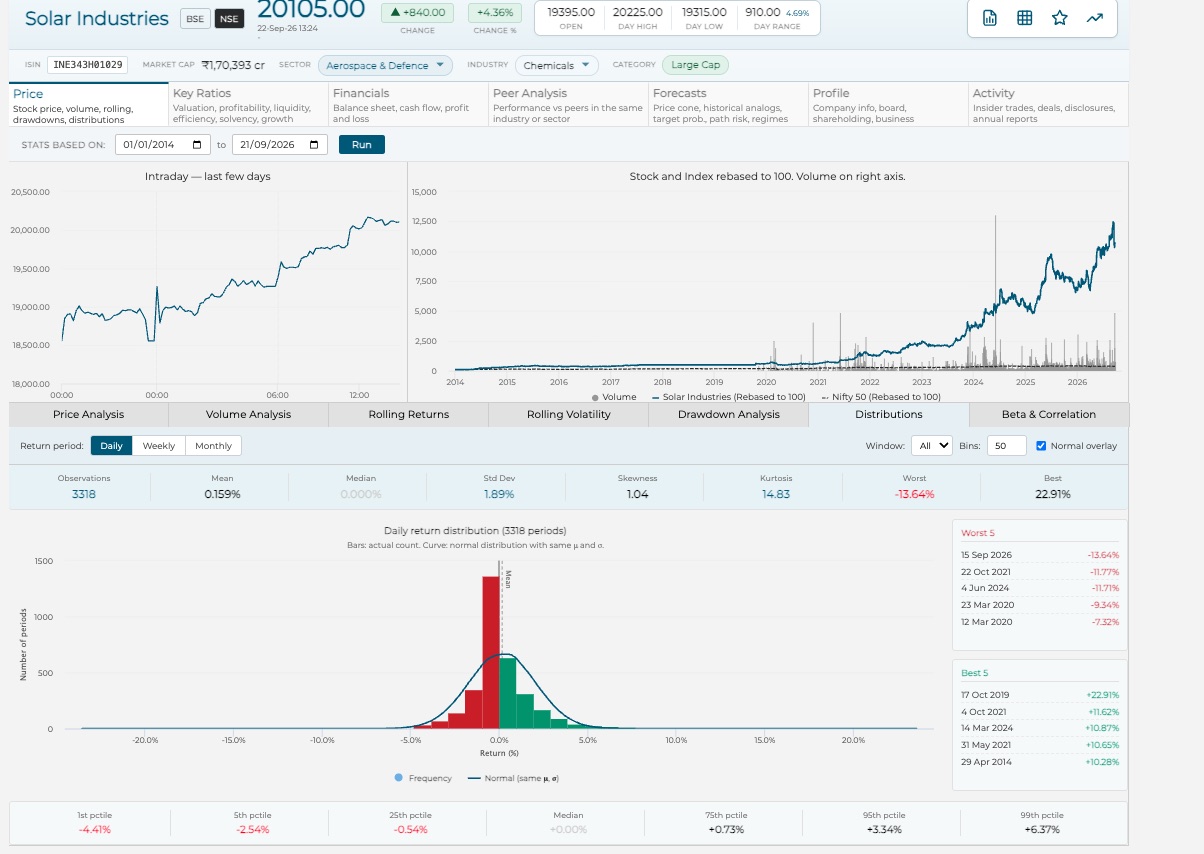
A stock page showing intraday and index-rebased charts above a daily return distribution histogram
The stock workspace: intraday and index-rebased history over a full risk-analysis board — here, daily return distributions.
Monte Carlo price cone chart with probability bands, median path, and calibration controls
Probabilistic forecasting: a 1,000-path Monte Carlo price cone with calibration and horizon controls.
Peer analysis snapshot with metric tiles against the peer median, rank strip, and sector leaders and laggards
Peer analysis: metric tiles against the peer median, period-by-period ranks, and sector leaders and laggards.
Portfolio backtester with NAV versus benchmark chart, period returns, and a monthly returns heatmap
The portfolio backtester: NAV against benchmark, period returns, and a monthly-returns calendar.
Equity screener with filters and a results table of Indian stocks with returns, Sharpe, and valuation columns
The screener: the full NSE/BSE universe filtered on pre-computed return, risk, and valuation statistics.
Watchlist heatmap showing colour-coded returns per stock across trailing periods
Watchlist analytics: colour-coded trailing returns across every stock in a list.

Engineering

How it's built

  • Fast by design. Stock pages and the screener read pre-computed statistics — 73 per stock, recomputed nightly for the whole universe — so interactive queries stay instant.
  • Analytics in the browser. Backtests, rolling statistics, correlations, and Monte Carlo simulation run client-side from bulk-fetched price series: one round-trip per portfolio.
  • Automated pipelines. A nightly end-of-day job reprices the full universe, fundamentals refresh from a licensed market-data vendor, and live quotes stream through market hours.
  • Commerce built in. Self-serve checkout with automated provisioning, GST-compliant invoicing, versioned terms acceptance with a stored legal record, and an audited support console.

Next

Have a platform to build?

We design, build, and operate systems like this end to end.

Get in touch