← All work

Case study

NGEN Markets UK

Institutional-grade fund research and portfolio analytics for the UK's independent financial advisers — designed, built, and operated end to end by ARK Angel Labs.

Fintech B2B SaaS United Kingdom Adviser tooling
Visit ngenmarkets.co.uk ↗

Overview

One methodology, from first screen to client portfolio

NGEN Markets UK lets independent financial advisers screen the whole UK open-ended fund universe, open any fund into a nine-tab analytical deep-dive, and assemble funds into client portfolios that get the same nine-tab treatment — backtested daily, benchmark-relative, computed live in the browser from raw price history rather than pre-canned factsheet figures. Every chart states exactly how it was calculated.

It is the second market for the NGEN platform family: analytics proven on the India platform, re-implemented for the UK's fund universe on licensed institutional data. ARK Angel Labs delivers it end to end — data ingestion pipelines, the in-browser analytics engine, the web application, and daily operations.

9,000+UK funds analysable, from 69,000 share classes
53M+daily NAV records behind the analytics
~200in-house daily category indices, back to 2003
9 tabsof analysis on every fund and portfolio

Capabilities

What the platform does

Whole-market screening

Filter 9,000+ primary UK funds across 64 data columns — returns to 15 years, risk, fees, size, concentration — with saved screens and preset views.

Fund deep-dives

Nine tabs per fund: performance against category, holdings, peers, fees with a 10-year cost-drag illustration, rolling returns, drawdowns, beta, and return profile.

Holdings intelligence

Monthly snapshots power change analytics and a positions-over-time matrix — every security's weight, month by month, colour-coded for builds and trims.

Portfolio backtesting

Weighted fund baskets get a backtested daily NAV, alpha and tracking error, correlations, and contribution analysis that reconciles exactly to the portfolio's return.

Self-built benchmarks

The default comparator is a category blend mirroring each portfolio's own weights, constructed from ~200 in-house daily category-average indices.

Quartile & peer history

Monthly quartile snapshots back to 2016 show how a fund's percentile has travelled, not just where it ranks today.

AI market briefings

An hourly intraday market flash and a daily long-form analysis on UK business days, always labelled as AI-generated.

Markets & macro

World indices, a UK/EU/US macro grid, commodities and volatility, 51 aggregated news sources, and AI country economy reports.

In the product
A closer look

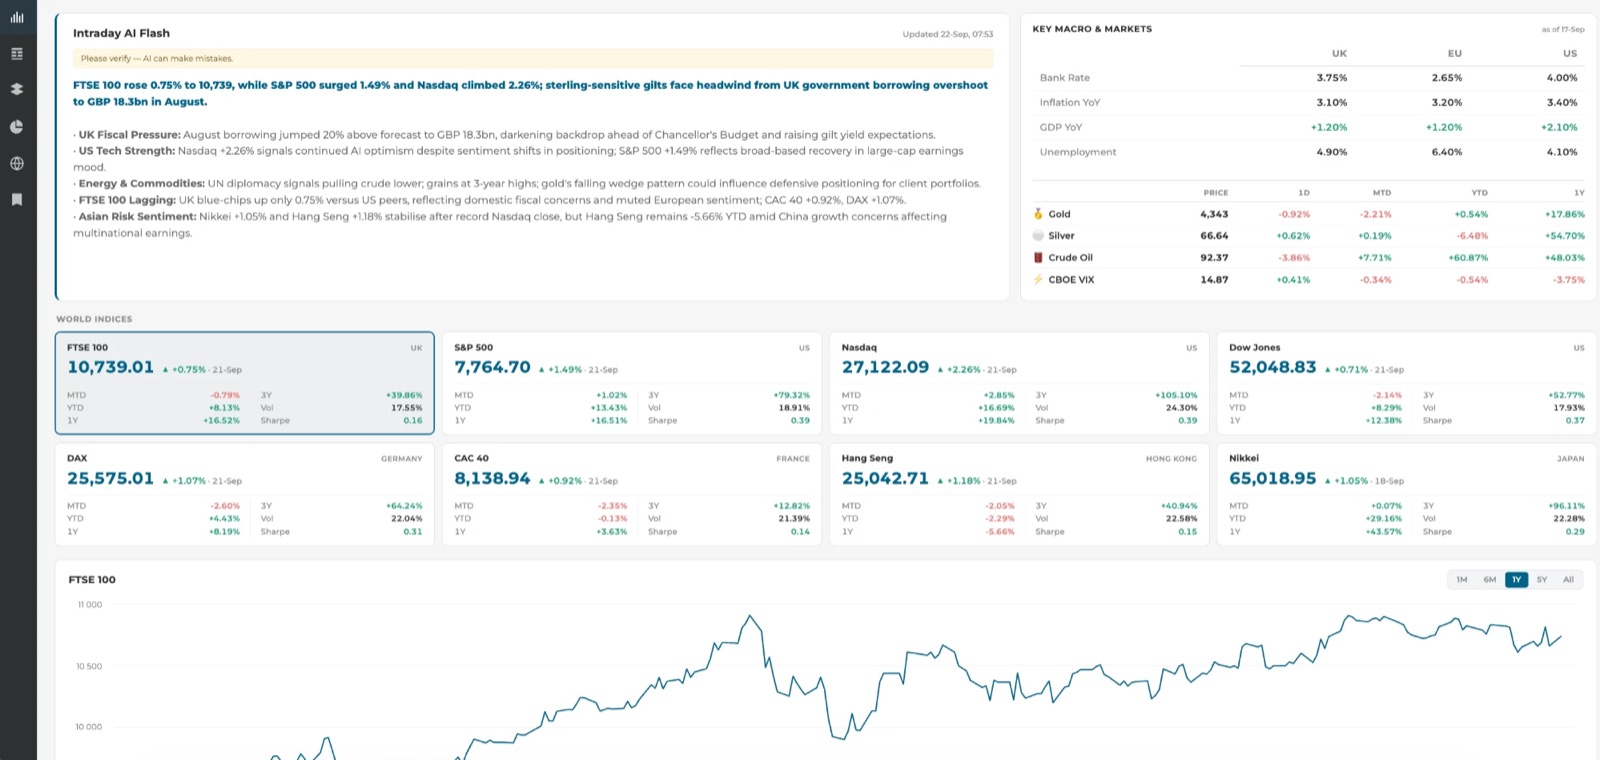
NGEN Markets UK dashboard with intraday AI market flash, macro rates table, and world index cards
The UK dashboard: hourly AI market flash, key macro rates, and world indices with risk statistics.
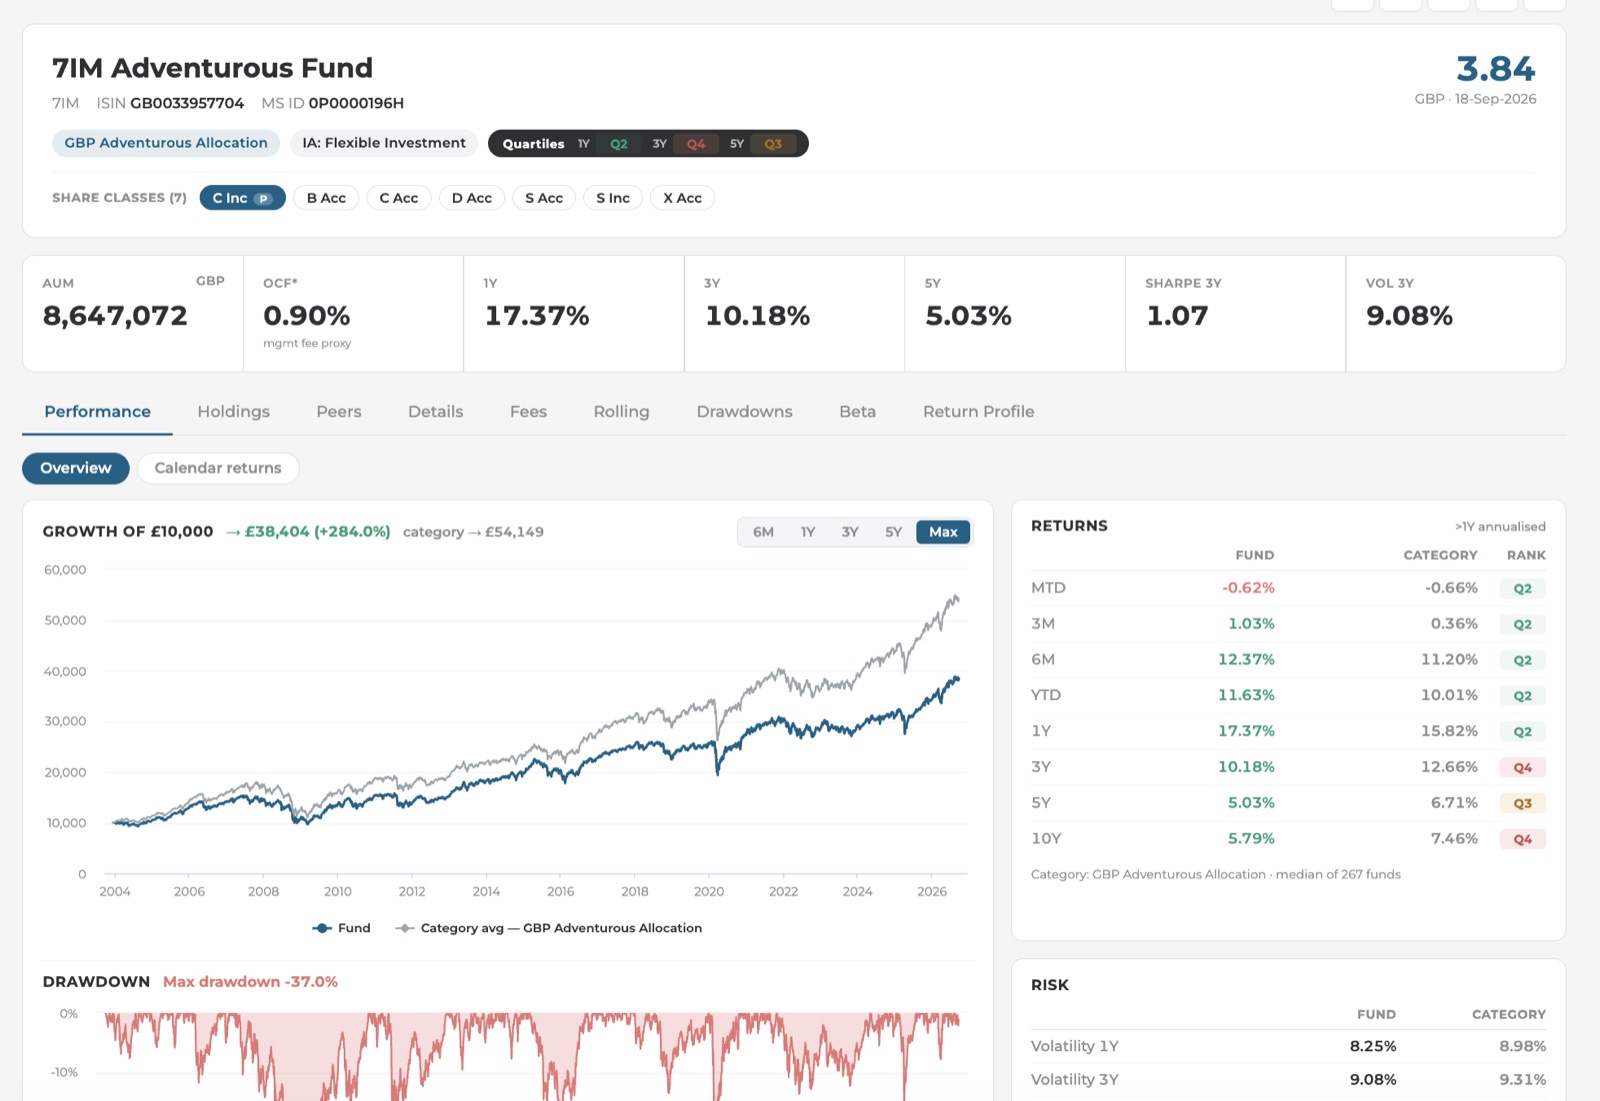
A UK fund page showing growth of £10,000 against the category average, drawdown chart, and quartile-ranked returns
A fund page: growth against the category average, drawdowns, and quartile-ranked returns over user-controlled windows.
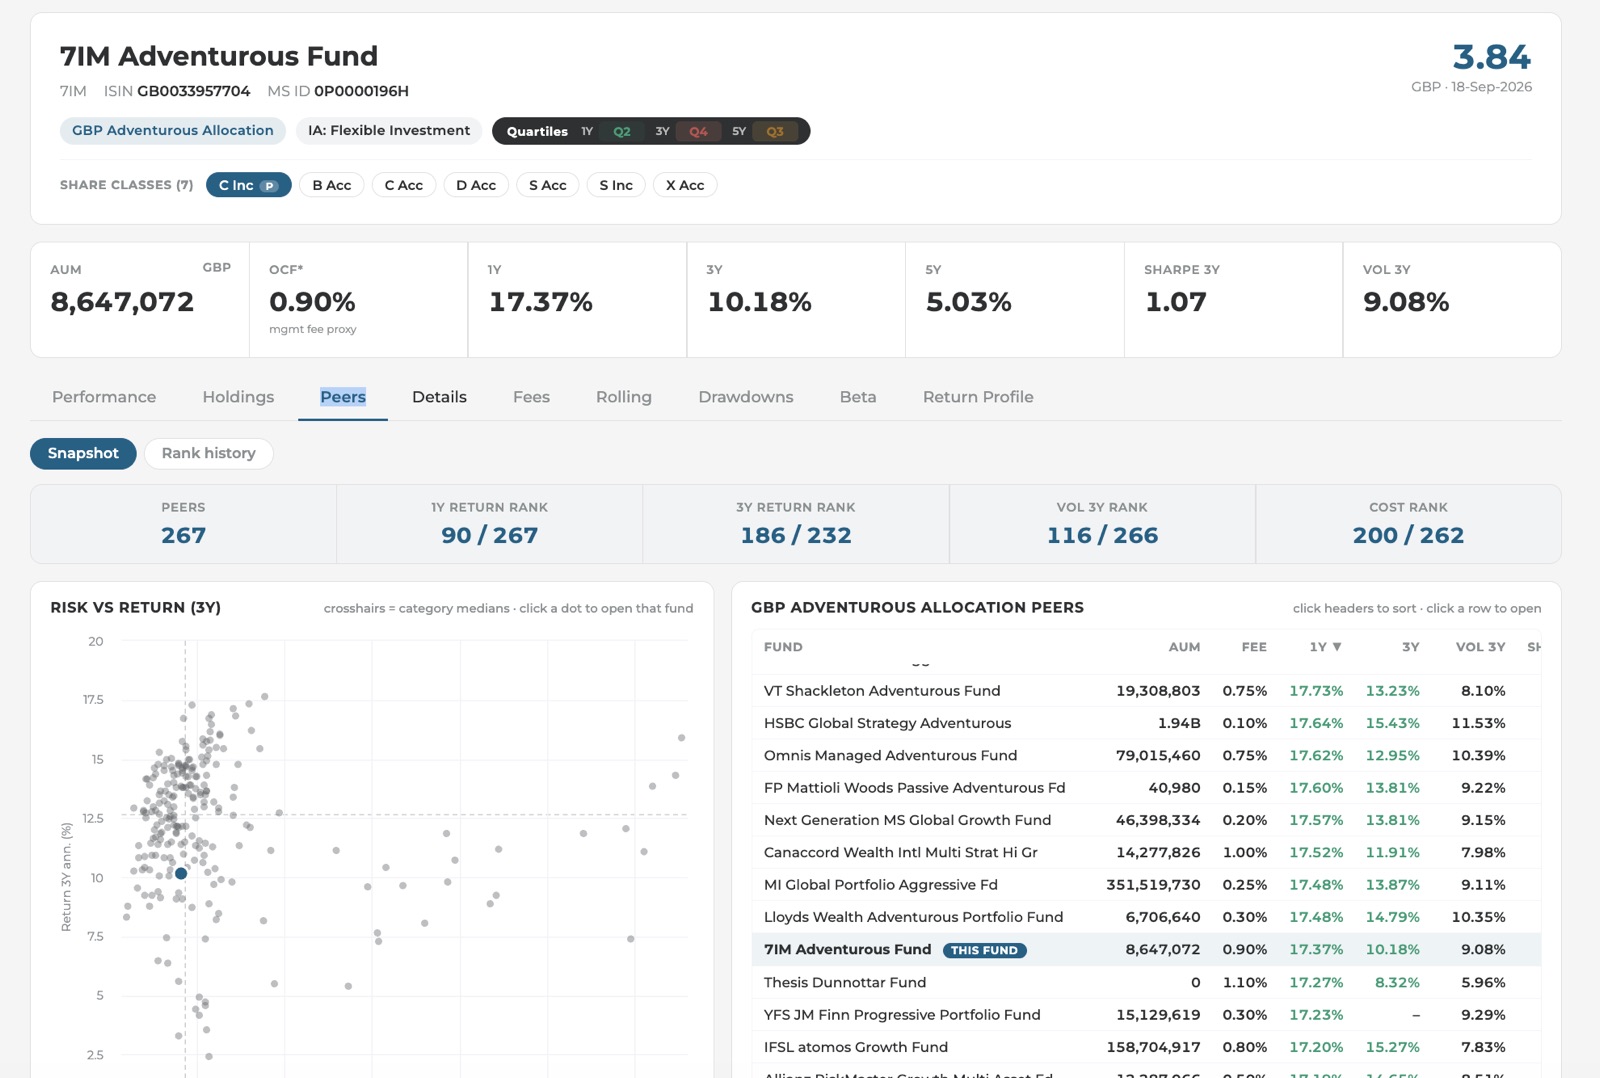
Peer analysis with rank tiles, a risk versus return scatter plot, and a sortable table of category peers
Peer analysis: rank tiles, a risk/return scatter against the category, and a sortable peer table.
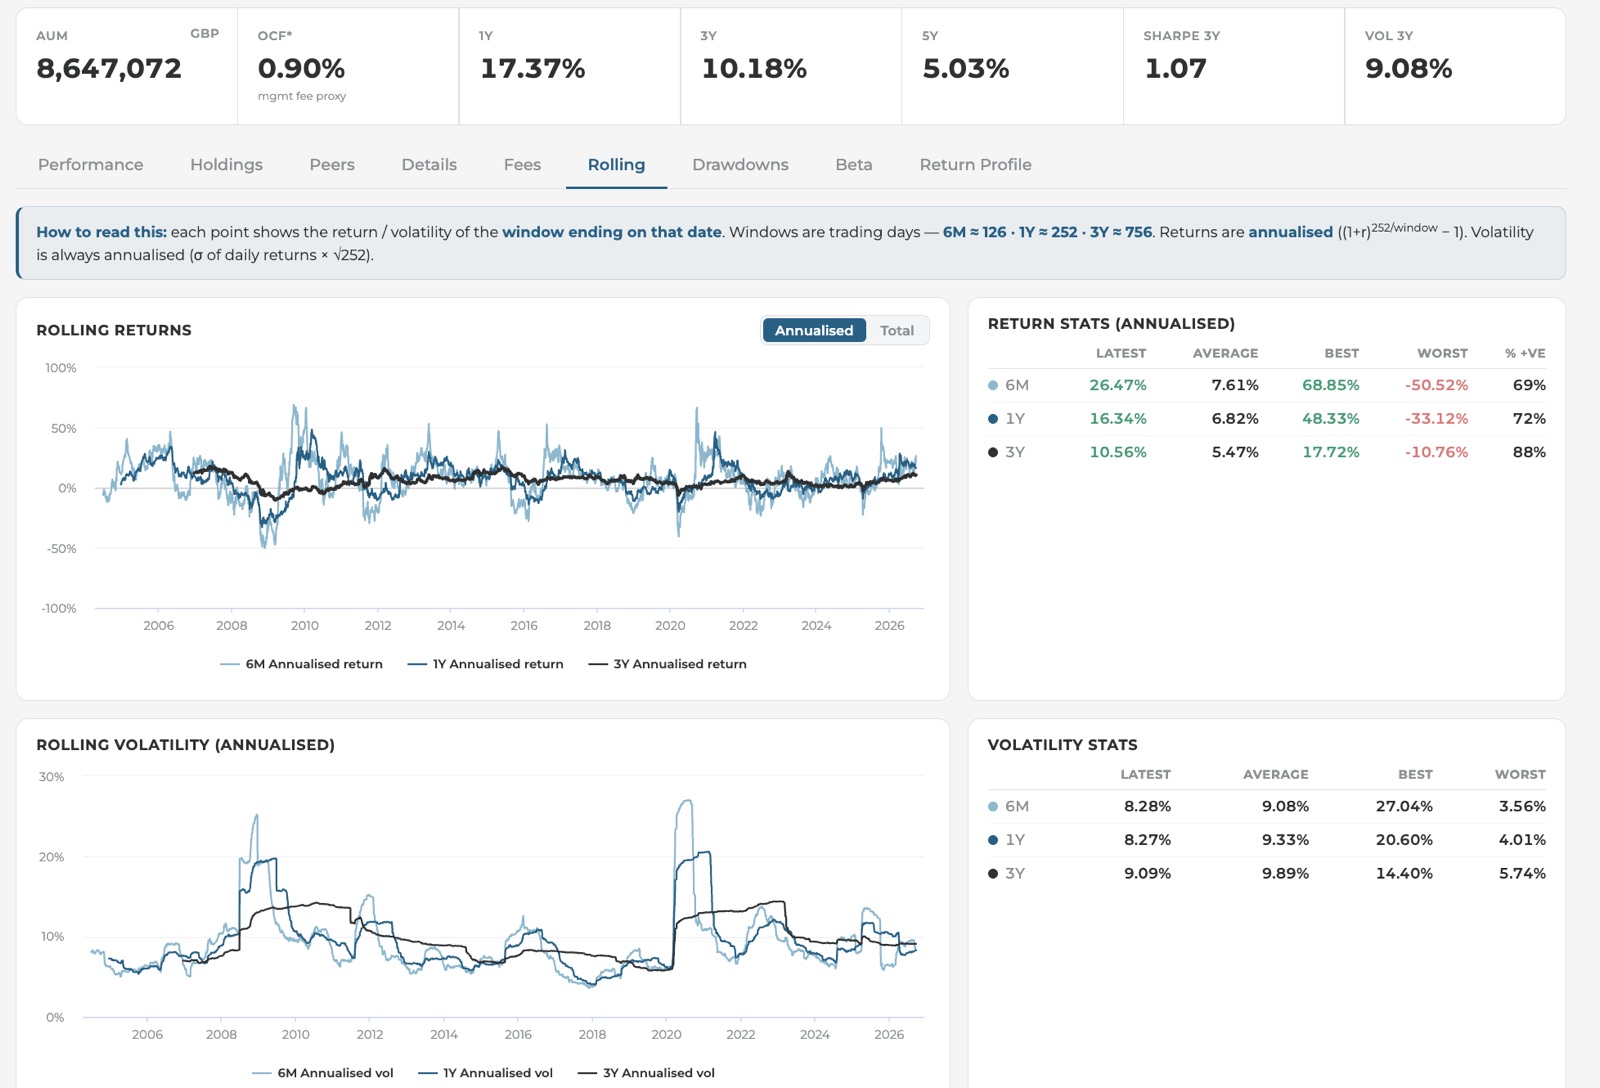
Rolling returns and rolling volatility charts with the calculation methodology explained above them
Rolling returns and volatility — with the calculation methodology stated right on the page.
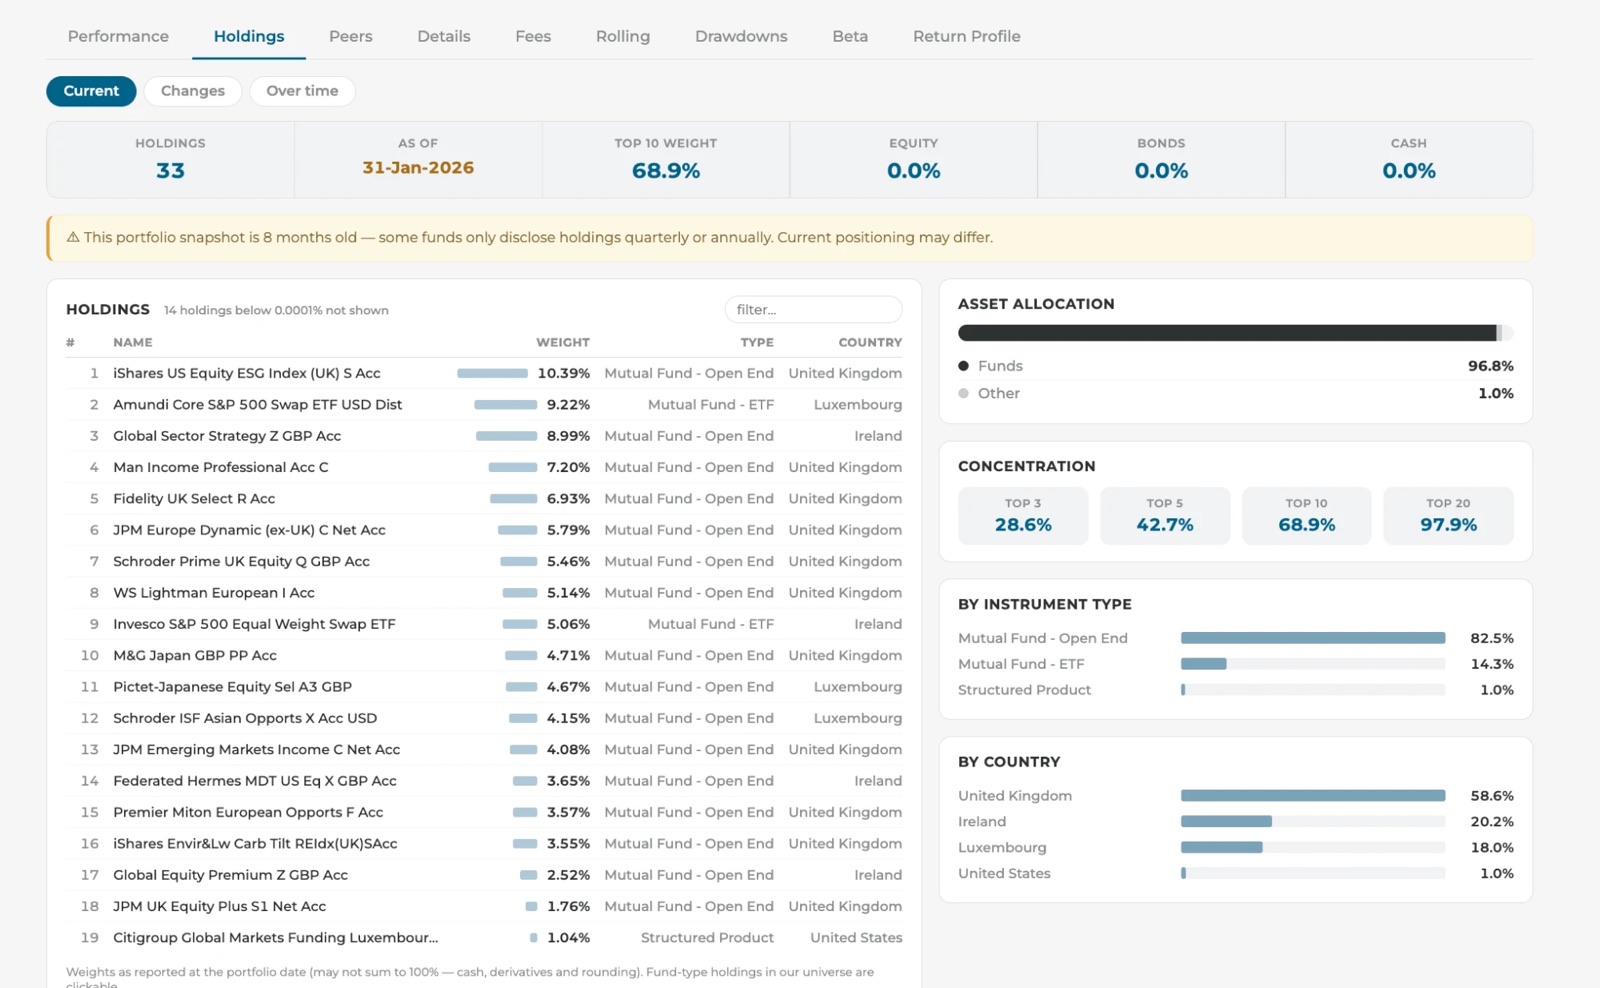
Fund holdings view with weights, concentration tiles, and instrument-type and country breakdowns
Look-through holdings with concentration, instrument-type, and country breakdowns — and honest data-age warnings.
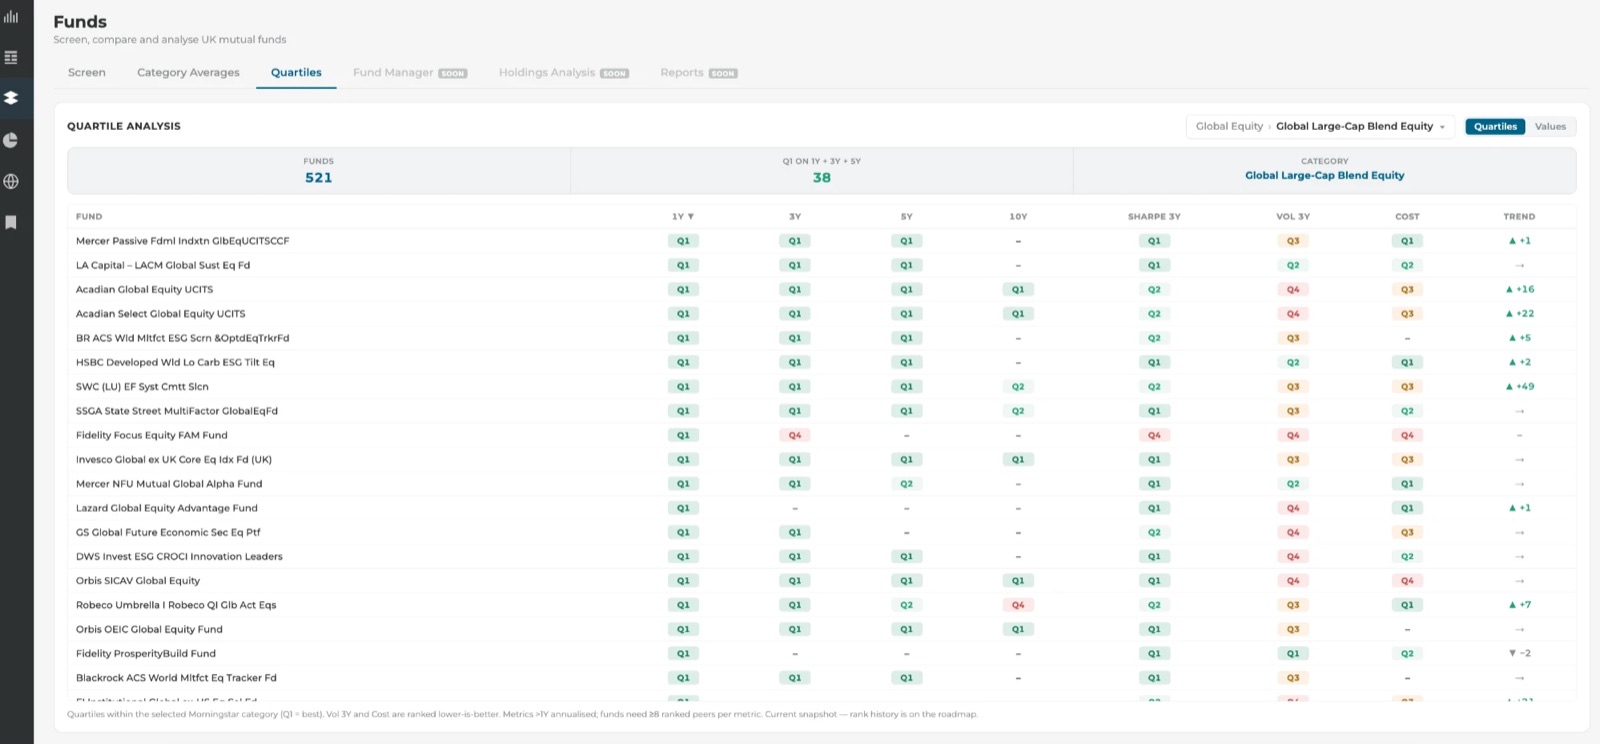
Quartile analysis table ranking a whole fund category on returns, Sharpe, volatility, and cost
Quartile analysis across a whole category: 1Y to 10Y returns, Sharpe, volatility, cost, and trend.
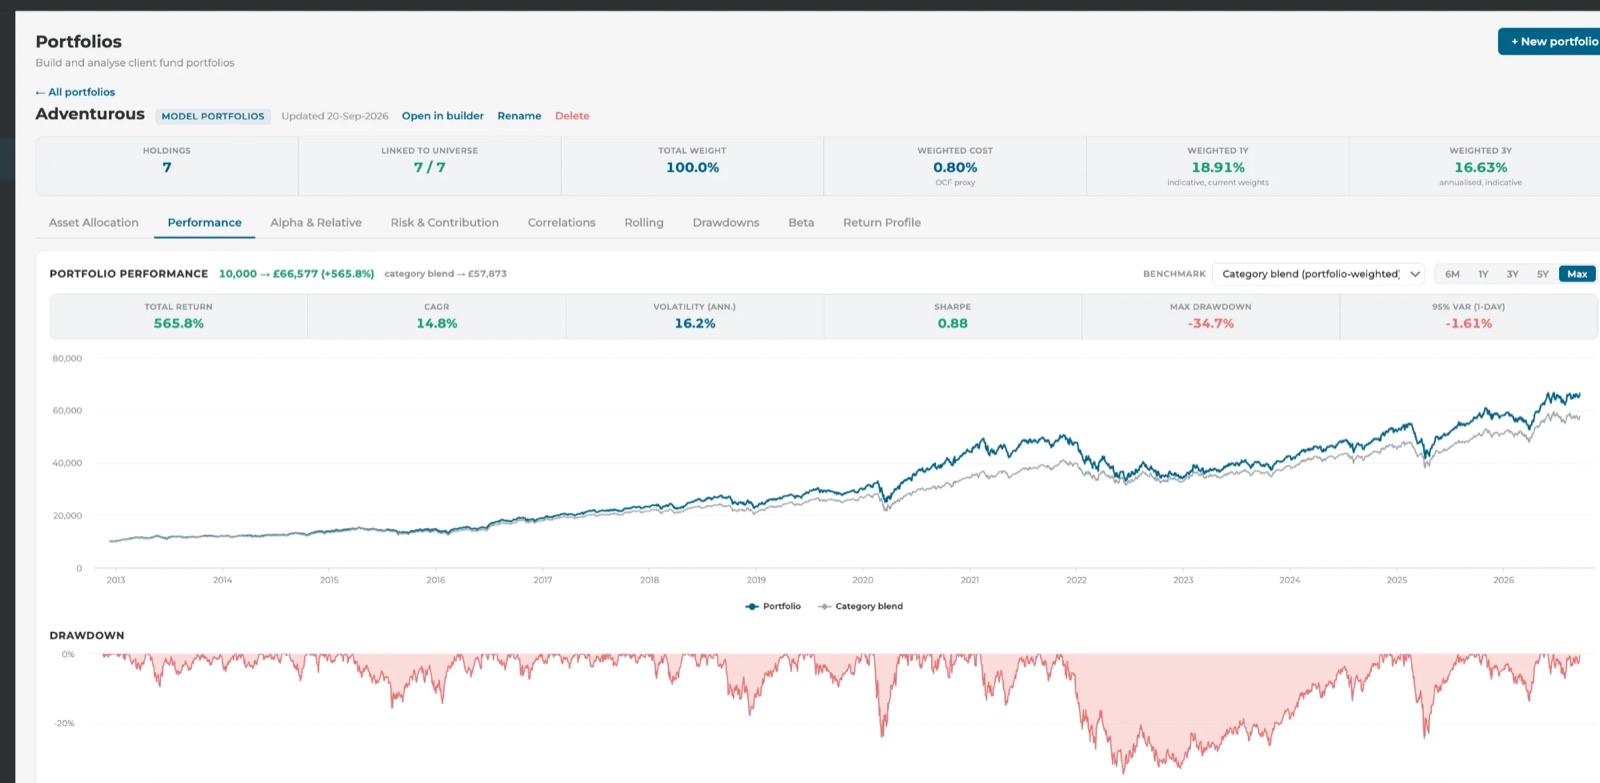
A model portfolio backtested daily and charted against its category blend benchmark with drawdown below
A model portfolio backtested daily against its portfolio-weighted category-blend benchmark.
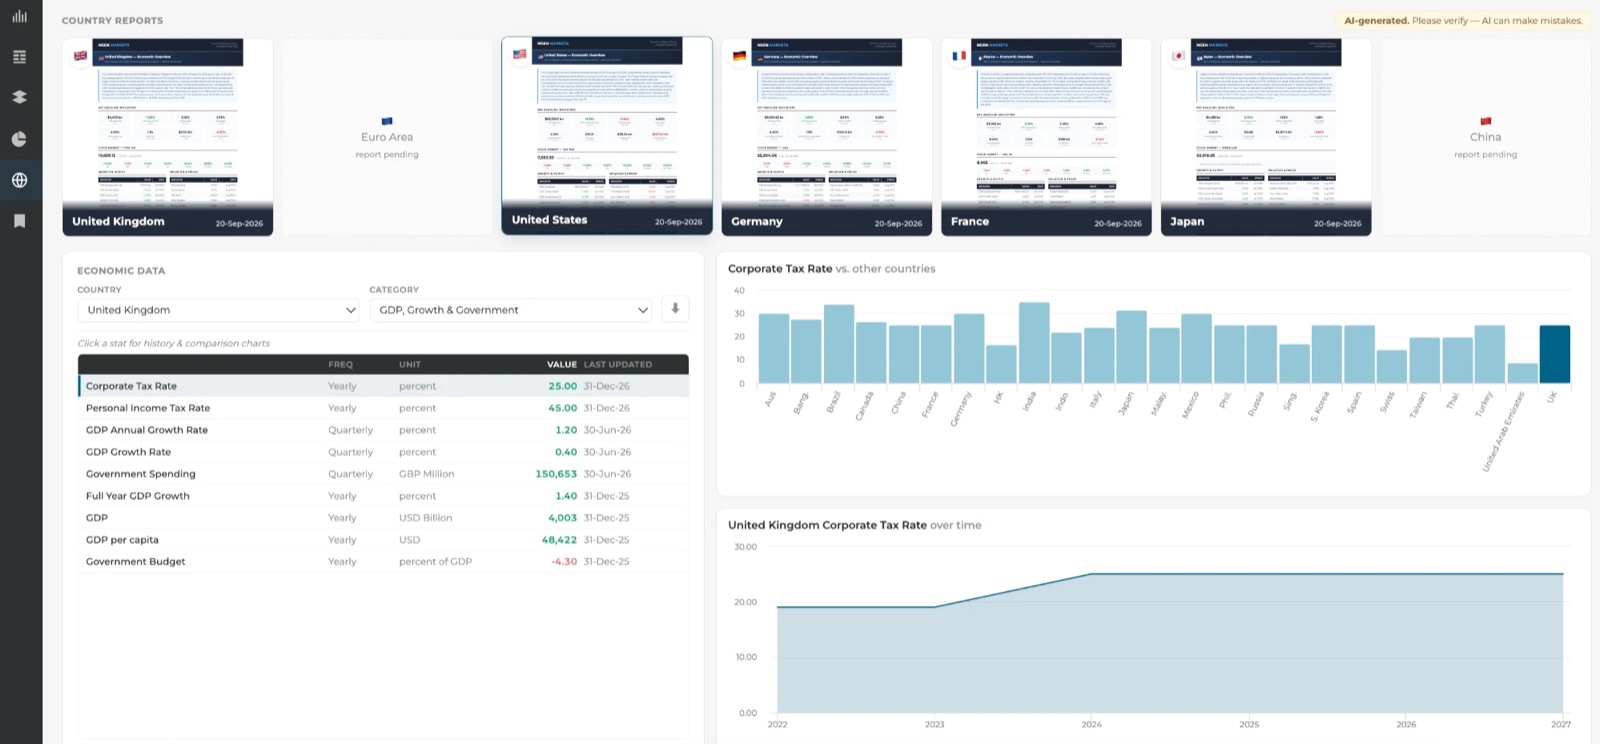
AI country economy reports alongside a macro statistics explorer with comparison charts
AI country economy reports and a drill-down macro statistics explorer.

Engineering

How it's built

  • Analytics computed in the browser. A deliberately lightweight, framework-free front end computes backtests, drawdown episodes, rolling windows, and correlations live from raw daily series — interactions are instant and every number is reproducible from visible inputs.
  • Automated data pipelines. A daily ingestion-to-statistics-to-index chain, nightly NAV refresh, and weekly holdings cycles, monitored for data freshness.
  • Tested against live data. An automated integration suite exercises the real application code against live data services on every significant change — including cross-checks that two independent implementations of the same statistic agree.
  • AI, labelled as AI. Market briefings are generated by scheduled backend services and always carry a verification disclaimer; AI never silently alters analytical numbers.

Next

Have a platform to build?

We design, build, and operate systems like this end to end.

Get in touch